codecogs equations

söndag 30 juni 2019

Searching expressions

During a coffee break at work, the following brainteaser came up:

0 0 0 = 6
1 1 1 = 6
2 2 2 = 6
3 3 3 = 6
4 4 4 = 6
5 5 5 = 6
6 6 6 = 6
7 7 7 = 6
8 8 8 = 6
9 9 9 = 6
10 10 10 = 6
For each row, one is supposed to fill in the operators that make the expression true. One is not allowed to add more digits, of course. The allowed operators are the arithmetic operators, exponentiation, square root, and factorial. For example, we have:

(1 + 1 + 1)! = 6
3 * 3 - 3 = 6
We solved 0 through 10, but struggled with 11. We also wondered whether there were some interesting solutions for 0-10 that we had missed.

I have been intrigued by symbolic programming and automated theorem proving since I first read about it. This seemed like a simple enough problem to start exploring those subjects. The first obstacle, which proved to be the most difficult one in the end, was conceptual blocks on my part. From proving mathematical theorems in university, I'm used to feeling that at each step in the derivation, there is an "infinite" number of possible moves, if only one is creative enough.

Tokens. x, y (numbers)
Unary operator. U: x -> y
Merge operator. M: x, y -> z

Example
State: [x, y, z]
Applied operation: M1 ('add'), index 0
Results: [M0(x, y), z] = [x+y, z]
Searching through expressions
However, if we want to do a systematic search in the computer, we need to be able to enumerate the possible moves. In our case, we have restricted ourselves to a finite number of operators, and there is a finite number of tokens to apply them to. So the number of moves in each step is not only enumerable, but finite. My idea for looking for an answer here is to simply do exhaustive search, using BFS (breadth-first search). Breadth-first search should help us find one valid solution quickly (if we assume that there is at least one relatively simple solution). However, if we want to find all solutions, it doesn't really matter which search algorithm is used, as we will have to go through all states anyway.

The really important thing is termination conditions. I pruned all states which had at least one token which was not a real integer. I also pruned all states with an integer larger than 1000.

Implementation
The search can be done very conveniently using networkx. The states are represented as nodes (the key is a tuple of the tokens). The edges are directed, and each edge has a feature with a representation of the operation. This help verify correctness, and display the result.

Another question is how to return solutions. First, I tried to return all simple paths from the starting stated to the goal state. For x=9, this gave over 17000 solutions. Clearly a lot of them were the same up to permutation. I decided to return one solution per immediate predecessor to the target state. For each immediate predecessor, I return the shortest path in the search graph. This brought down the number of solutions to no more than a few 10's at most.

Results
The resulting successful computations can be plotted using graphviz via pydot. Installed through:

apt-get install graphviz
pip3 install pydot

Some examples. The _index suffixes are there because pydot doesn't accept custom labels.

The only solution found for 1.


One of two solutions found for 8.


One of 22 solutions found for 9.

The searcher found many solutions that I hadn't thought about, however most were not very interesting. I ran it for numbers up to 1000, and sadly there was not a lot of surprises. Going back to the problem we had in the beginning, it did not find a solution for 11. The workable numbers up to 1000 are typically very even numbers. The highest workable I found was 729, which goes through 81:

Path from 729. which goes through [729, 729, 729]->[27, 27, 27]->81->9->3->6.

The highest workable prime found is 37, which goes through 36:


Conclusion
This was a very fun exercise and it yielded successful results quickly, even if it was not so surprising. It should be noted that we're relying on numerical answers here as opposed to having an exact representation of numbers. This works well for integers, but wouldn't generalize to reals.

torsdag 27 juni 2019

Convex Hull: correlated points

Previous:

In the previous post, I investigated the convex hull of random point clouds. I found that as we add more dimensions while keeping the number of points the same, the expected volume decreases sharply. One way to think of this is that in high dimensions, almost all points in a random point cloud will lie on the edge of the convex hull, very few will be "surrounded" by the other points. 

In this post, I want to see what happens if the points are not random, but correlated to each other. Why might we think so? Well, strongly correlated systems have in a sense fewer degrees of freedom, so we expect them to behave like lower dimensional problems. Like this:

Correlated points in R^2. Out of the 100, 90% of the points are in the interior of the convex hull of the other points. These are marked on blue. The points on the edge of the convex hull are marked in red.

How to sample correlated points in R^N
Generate a square matrix A with uniform random elements, each with expectation 0. For each point in the point cloud, generate N gaussian random numbers, and apply A to these. The covariance matrix will be AA^T. 

2 dimensions

Making 100 random trials gives that the average k-fold inclusion is 91%, compared to 88% for just random point clouds. So the difference is not big, not even statistically significant. The empiric variance of an estimate probability p in a binary distribution is n*p*(1-p), where n is the number of trials. With n=100 and p=0.9 in our case, this comes out to about 8. So the standard deviation is about 2.8, pretty much the same as the difference between the sets. We might want to apply a real test here, something that respects the binary distribution. But that's silly; if we wanted something more accurate we should just make more tests. 

10 dimensions

Doing this in 10 dimensions give an estimate of 5.6% for the independent point clouds, and 6.0% for the correlated point clouds. Once again, not significant. 

Conclusion

When we observe high-dimensional systems, almost all observations will be "extreme" in some direction, even if the system is structured. 


måndag 24 juni 2019

Sampling: simple stable Autoregressive

I want to try out the convex hull inclusivity tester on data that is less random. One way to get such data is to sample a stable ARMA process. In fourier space, an ARMA can be expressed as a quotient of two polynomials:


P contains the poles, and Q contains the zeroes, or nills. In this post, I use only Q = 1.
The criterion for stability is that all roots of P is in the unit circle. To get a uniform sampling from the unit circle, we can sample an angle from a uniform distribution, and an absolute value from a triangle distribution (since the density must increase linearly with the absolute value). The code:

This output format fits perfectly into the ArmaProcess object from statsmodels.

Random stable AR process from 5 pairs of poles.

söndag 23 juni 2019

Convex Hull

I want to find the convex hull of some set of points in  (a euclidean space of arbitrary dimension). I am hoping that this will be an interesting programming exercise, and that it will provide some insight into the properties of higher dimensions.

Definition

The Convex Hull of a set S is the smallest convex set that contains all elements of S. So much for the mathematical definition. Intuitively, we can think of the convex hull as the shape of a rubber band that encloses all points in S. 

Example of the convex hull of a set of points. 

A Simple Test

When starting out, I thought about explicitly constructing the convex hull. This is indeed something we will get to later. By explicitly constructing the hull, I mean finding the linear subspaces that constitute it. In the example above, that would imply finding the line equations of the red lines. However, it struck me that this is not necessary if all we want is to test whether some given point is inside the convex hull or not. There is a way to do it by solving a single linear programming problem. We use the following fact:

A vector u is in the convex hull of a set of points if u can be expressed as a convex linear combination of the vectors in V. That is:


such that:

.

This can be readily formulated as a linear program, where u and V are given, and the lambdas are variables. The code:

This works beautifully in 2D:

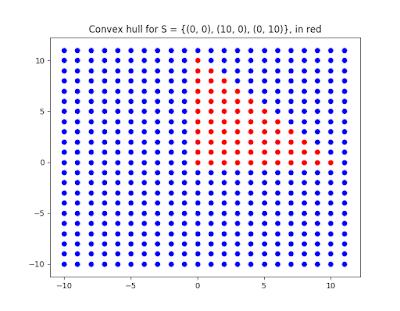
Convex hull for the set of points (0, 0), (1, 0), (0, 1), marked with red dots. Sampled in the integers. 

Convex hull (red) of random points (green) sampled in the integers. 

Volume of Convex Hull using Monte Carlo

One question I had was: "suppose we take 10 random points sampled from the unit cube, what is the expected volume of their convex hull?". This requires a nested simulation. On the highest level, we need to sample a lot of 10-point sets and measure their volumes. And for each volume that we want to measure, we need to sample a lot of points to get an accurate Monte Carlo estimate of the volume. Some initial tests:

dim | volume: 10 points | volume: 100 points
2D  | 0.42              | 0.88
3D  | 0.14              | 0.69
4D  | 0.035             | 0.45

What can we say from this? Not much more than that the average coverage decreases as the number of dimensions increase.