We have data on the
number of cases and what is the
delay from onset to confirmation.
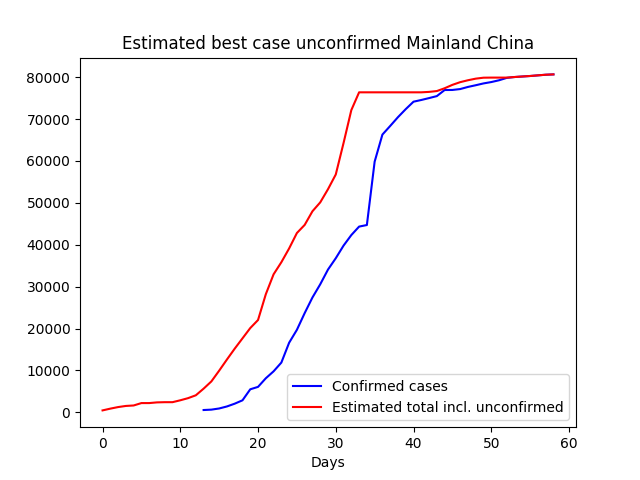
We use this to estimate a best case scenario for the number of unconfirmed cases.
Answer: best case in Europe and US is the total number of cases is 2 times the confirmed cases. So double the official figure. The situation is better in Asia: Japan and South Korea have a best case bound of about 10% extra.
More in depth info about the method below the graphs.
 |
| Belgium |
 |
| France |
 |
| Germany |
 |
| Iran |
 |
| Italy |
 |
| Japan |
 |
| China |
 |
| Netherlands |
 |
| Norway |
 |
| Singapore |
 |
| South Korea |
 |
| Spain |
 |
| Sweden |
 |
| Switzerland |
 |
| United Kingdom |
 |
| United States |
Method
Suppose that the pattern of delay from onset to confirmed infection with COVID19 is as in:
For each country, we have a time series of the number of confirmed cases, call these Y. The total number of cases with symptoms each day are our unknowns, call these X. For each day, there is one observation and one unknown. We also have extra unknowns in the start, because of the delay. So there are many sets of X which will fit the data Y.
How to choose between them? What I do here is to, instead of picking the model for X that I think is most likely, pick the model which gives the most actionable information. Actionable information in this case is that we know that at least so-and-so many are infected. If the best case is bad, and it is, then we know that it is not an option to choose inaction.
Choose the most optimistic X by penalizing all x values over 0 in the fit model. Implicitly, this means that we think that the most likely world is one where there are no new cases each day. This way, the data does the whole job of "lifting" up our estimation of X.
References


Inga kommentarer:
Skicka en kommentar